introducing
AI Assessment Engine
An AI platform that analyses learner submissions from institutional assessments and generates competency-based skills reports — giving learners, teachers, and institutions visibility into 21st-century capabilities.

The problem
Narrow assessments
Education systems measure success through tests and exams — revealing very little about how learners think, solve problems, collaborate, or persist.
Hidden capabilities
21st-century competencies go unmeasured and unrecognised. There is no system-wide way to identify, track, or compare these skills.
No evidence
There is no simple way for a learner — especially in a low-income school — to show evidence of these skills to teachers, funders, or future opportunities.
How it works
01
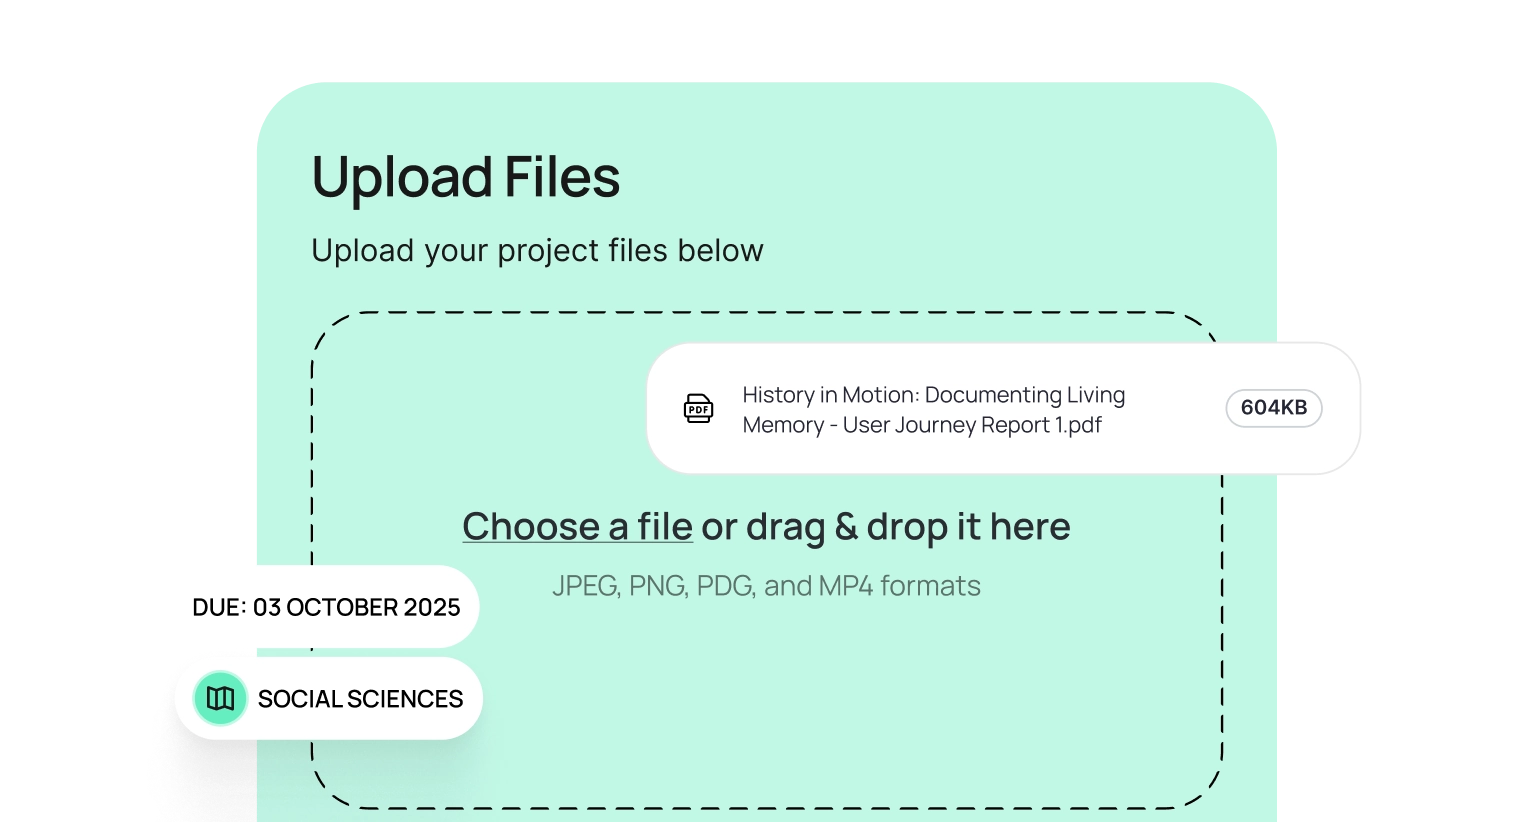
Upload learner work
Learner work is uploaded to the platform — projects, reflections, portfolios, videos, and written responses that demonstrate what learners can actually do.
02
AI analyses against the competency standard
Learner work is uploaded to the platform — projects, reflections, portfolios, videos, and written responses that demonstrate what learners can actually do.
03
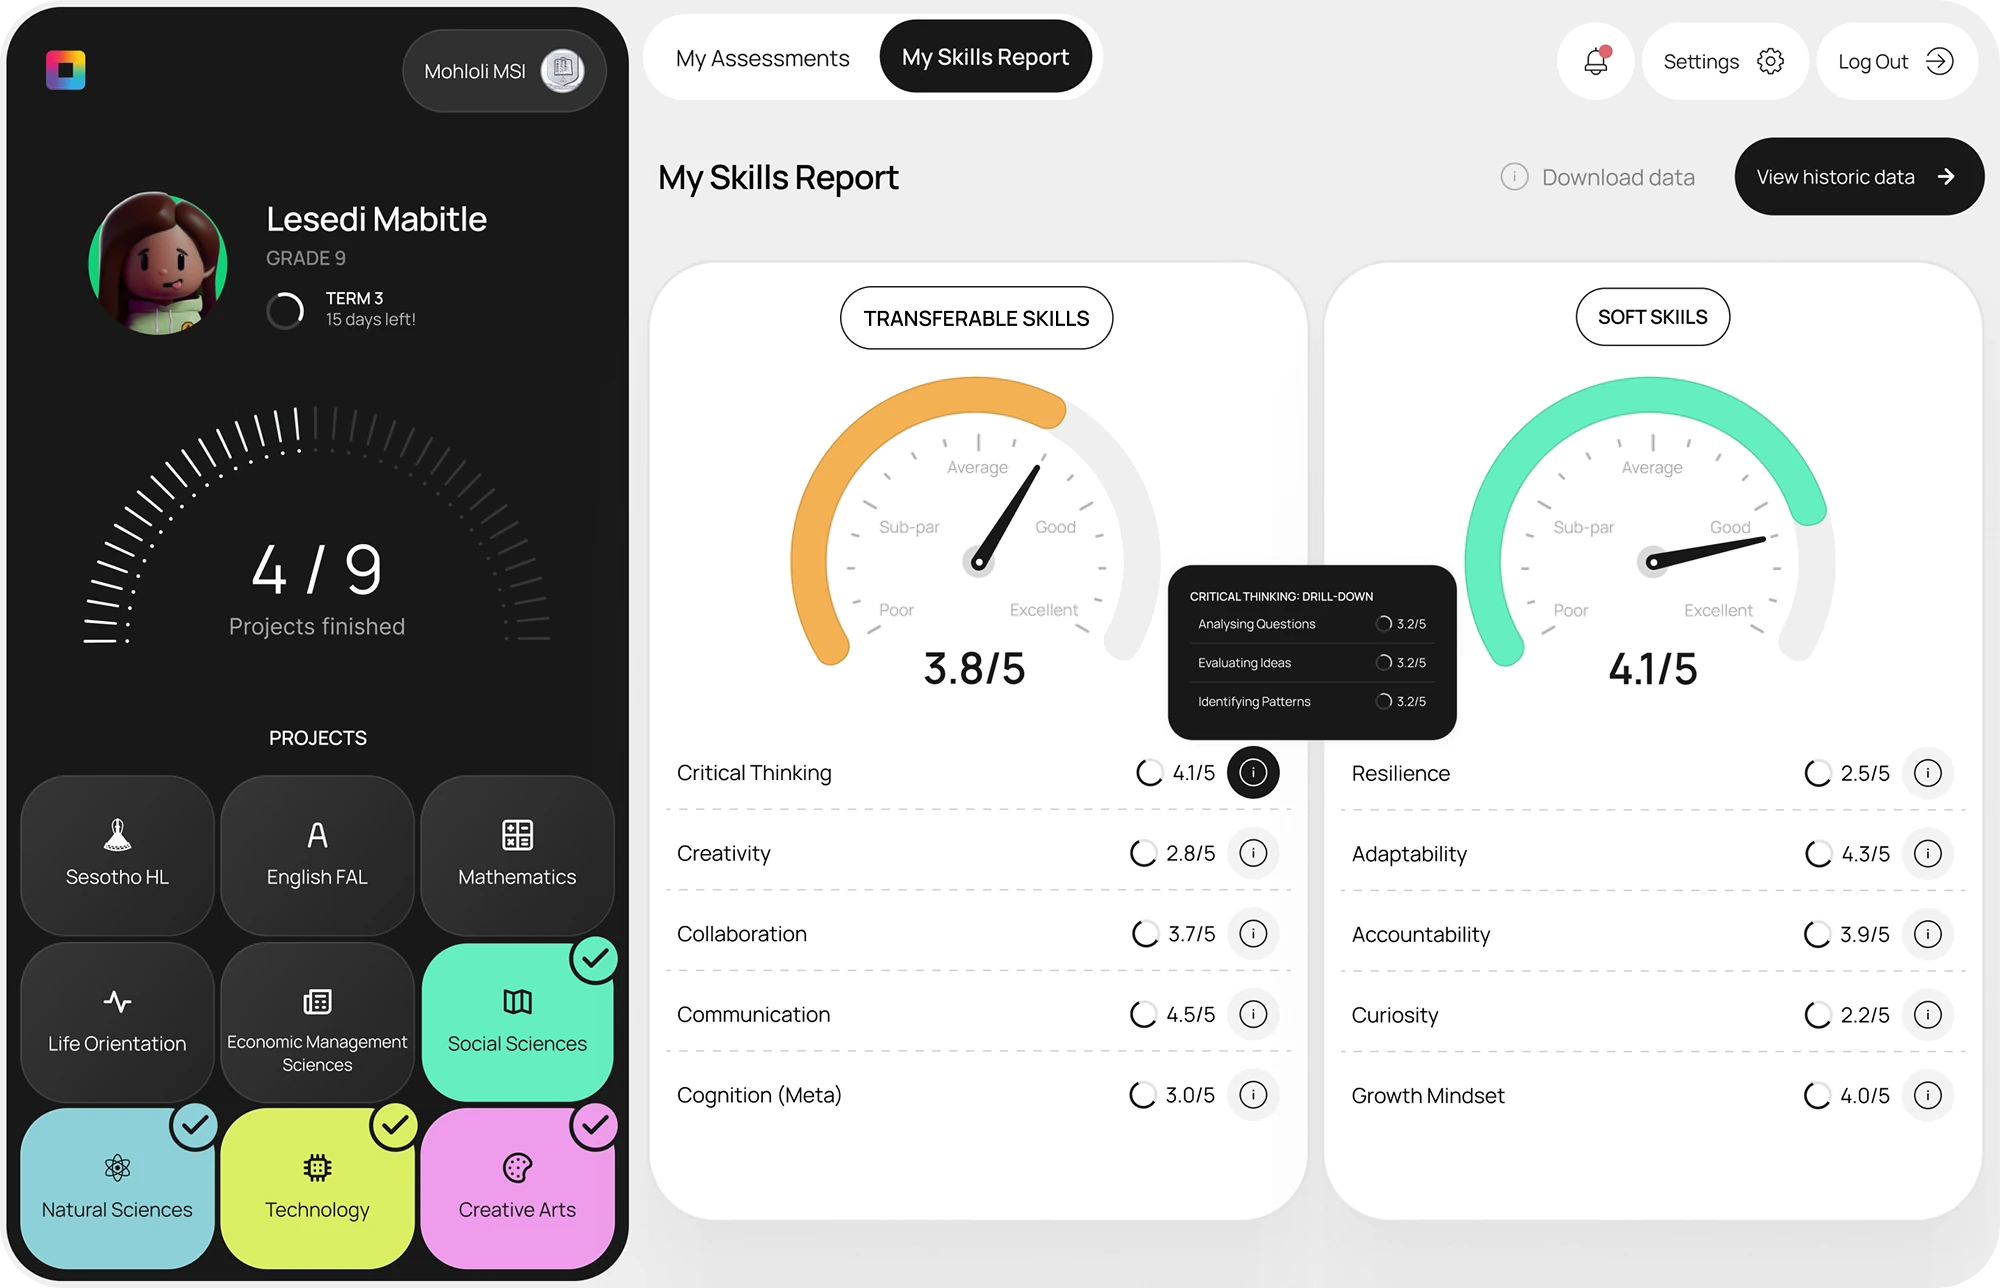
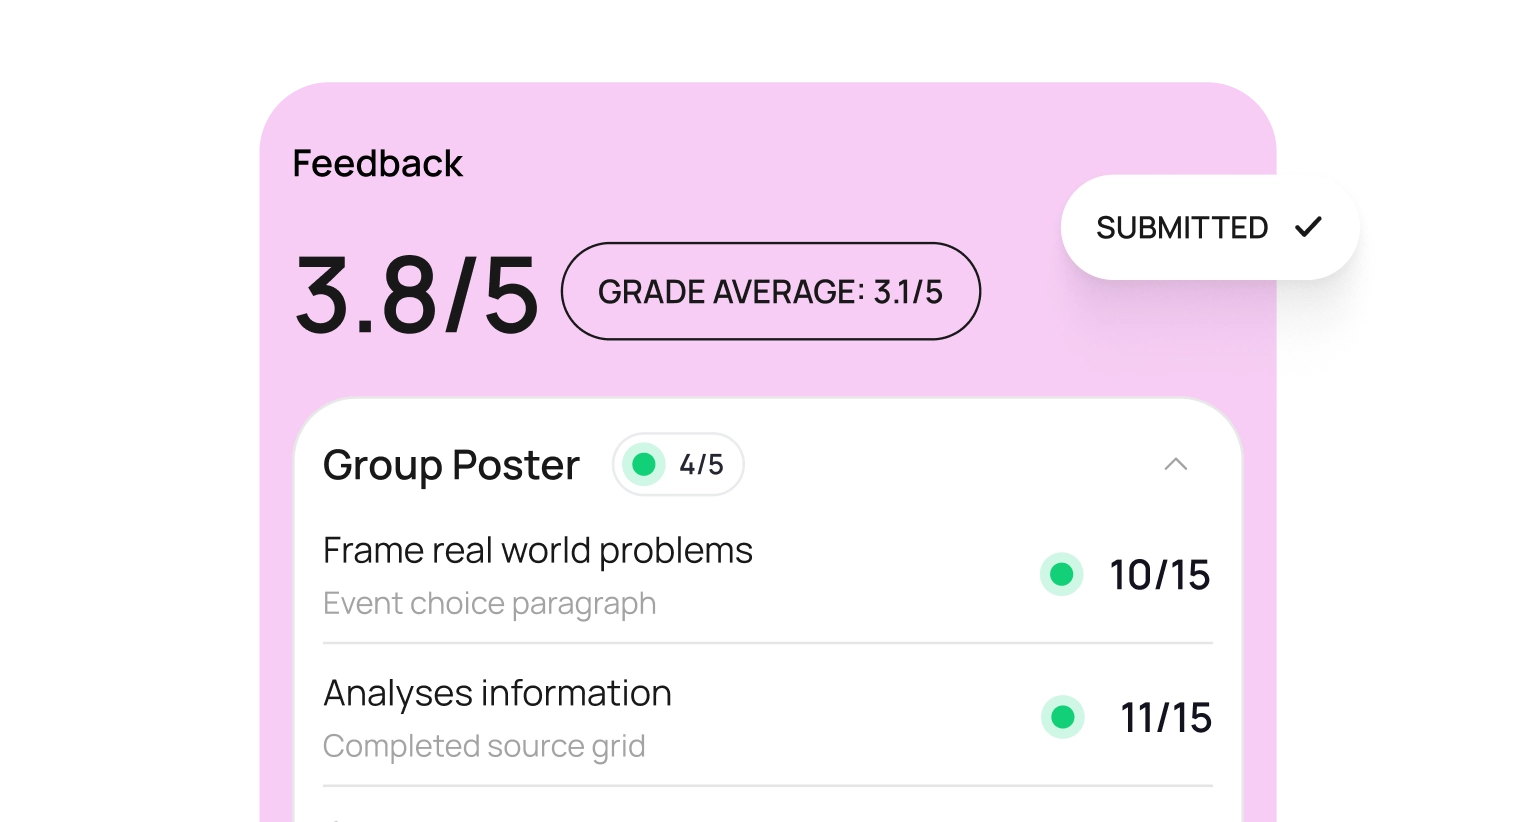
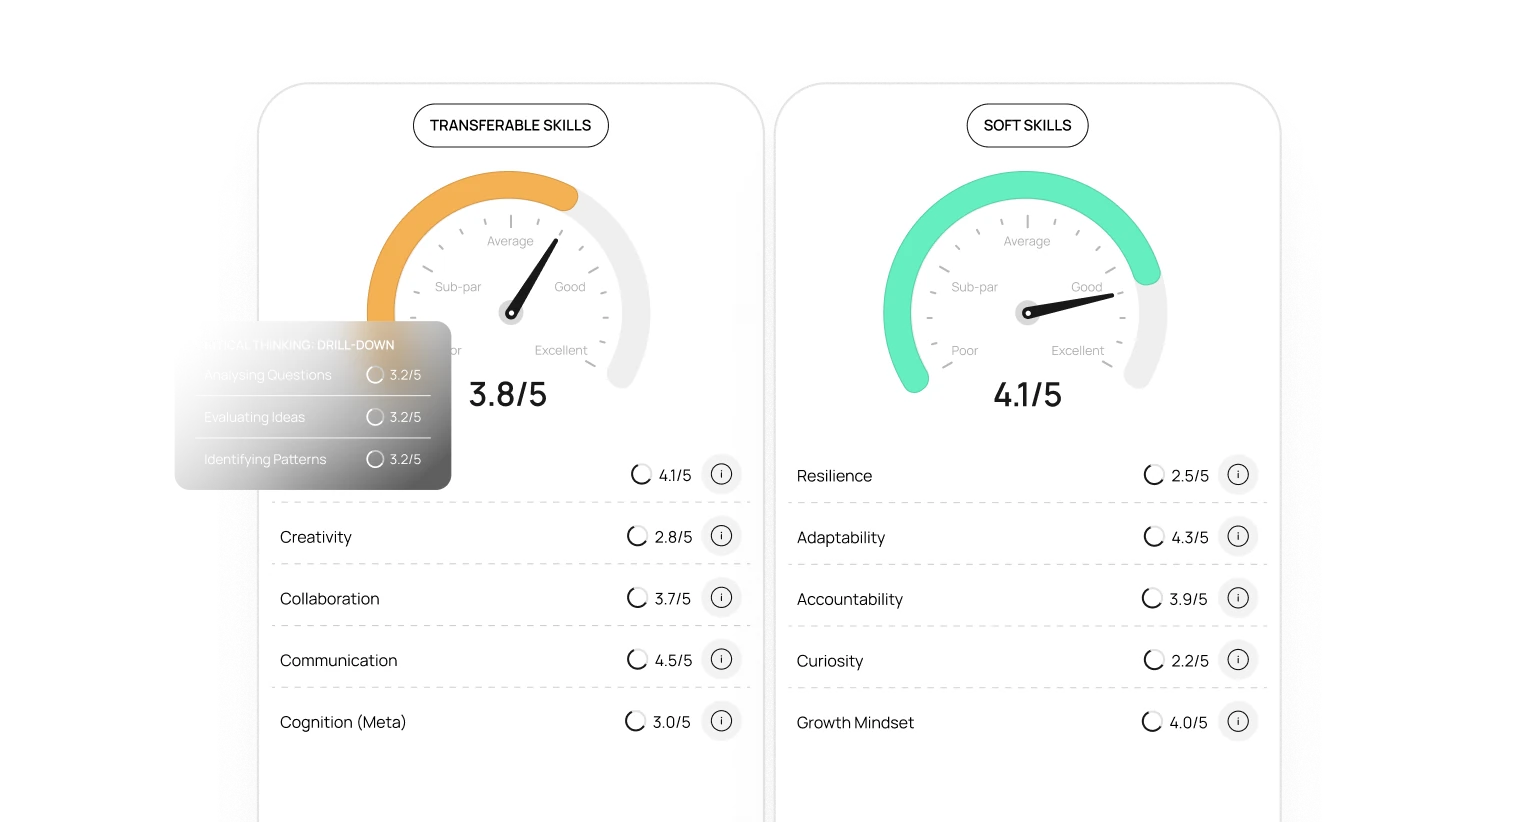
Evidence surfaces with explanations
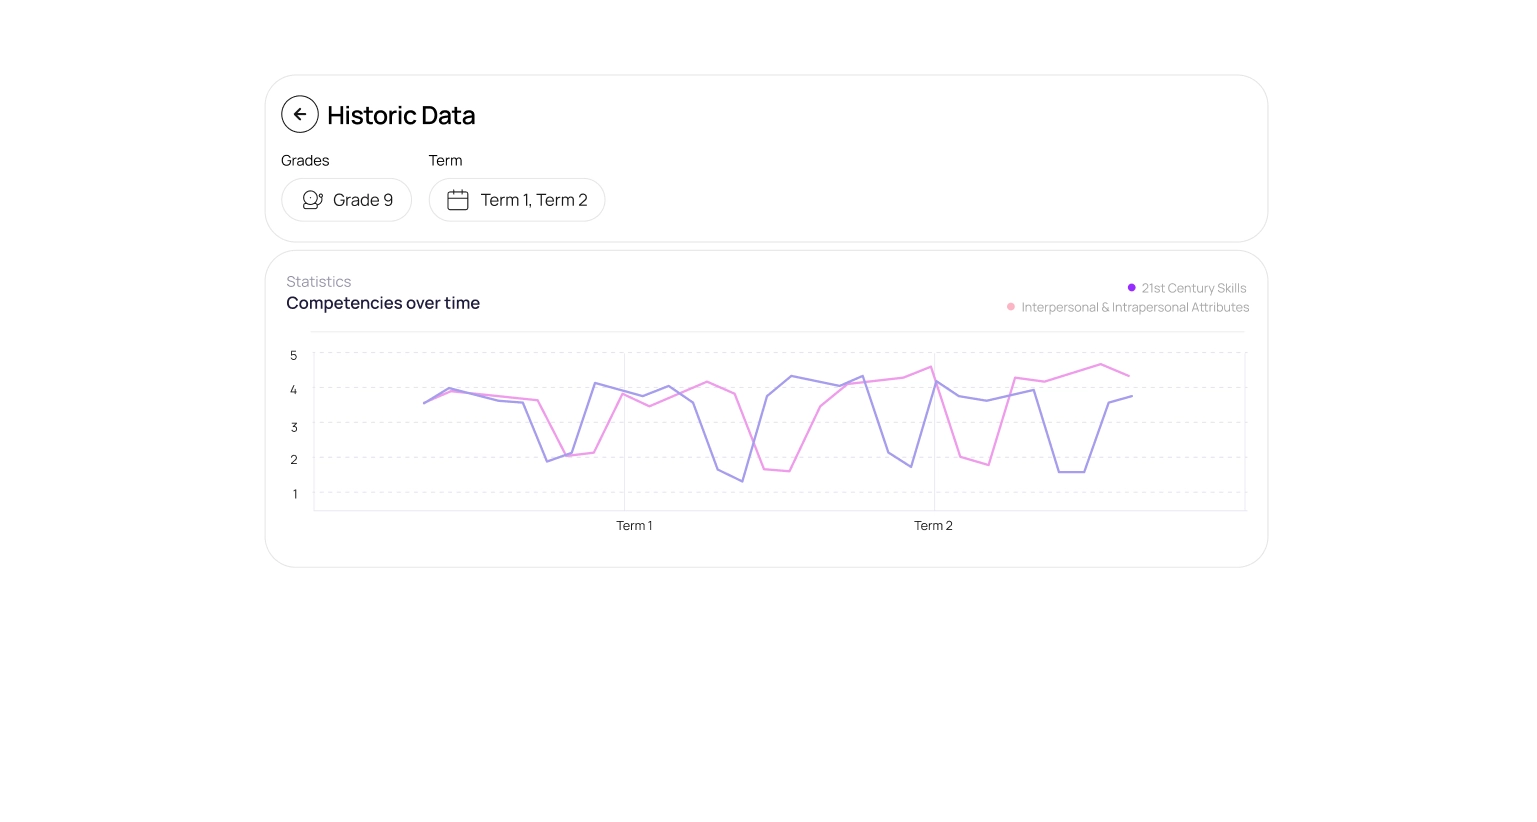
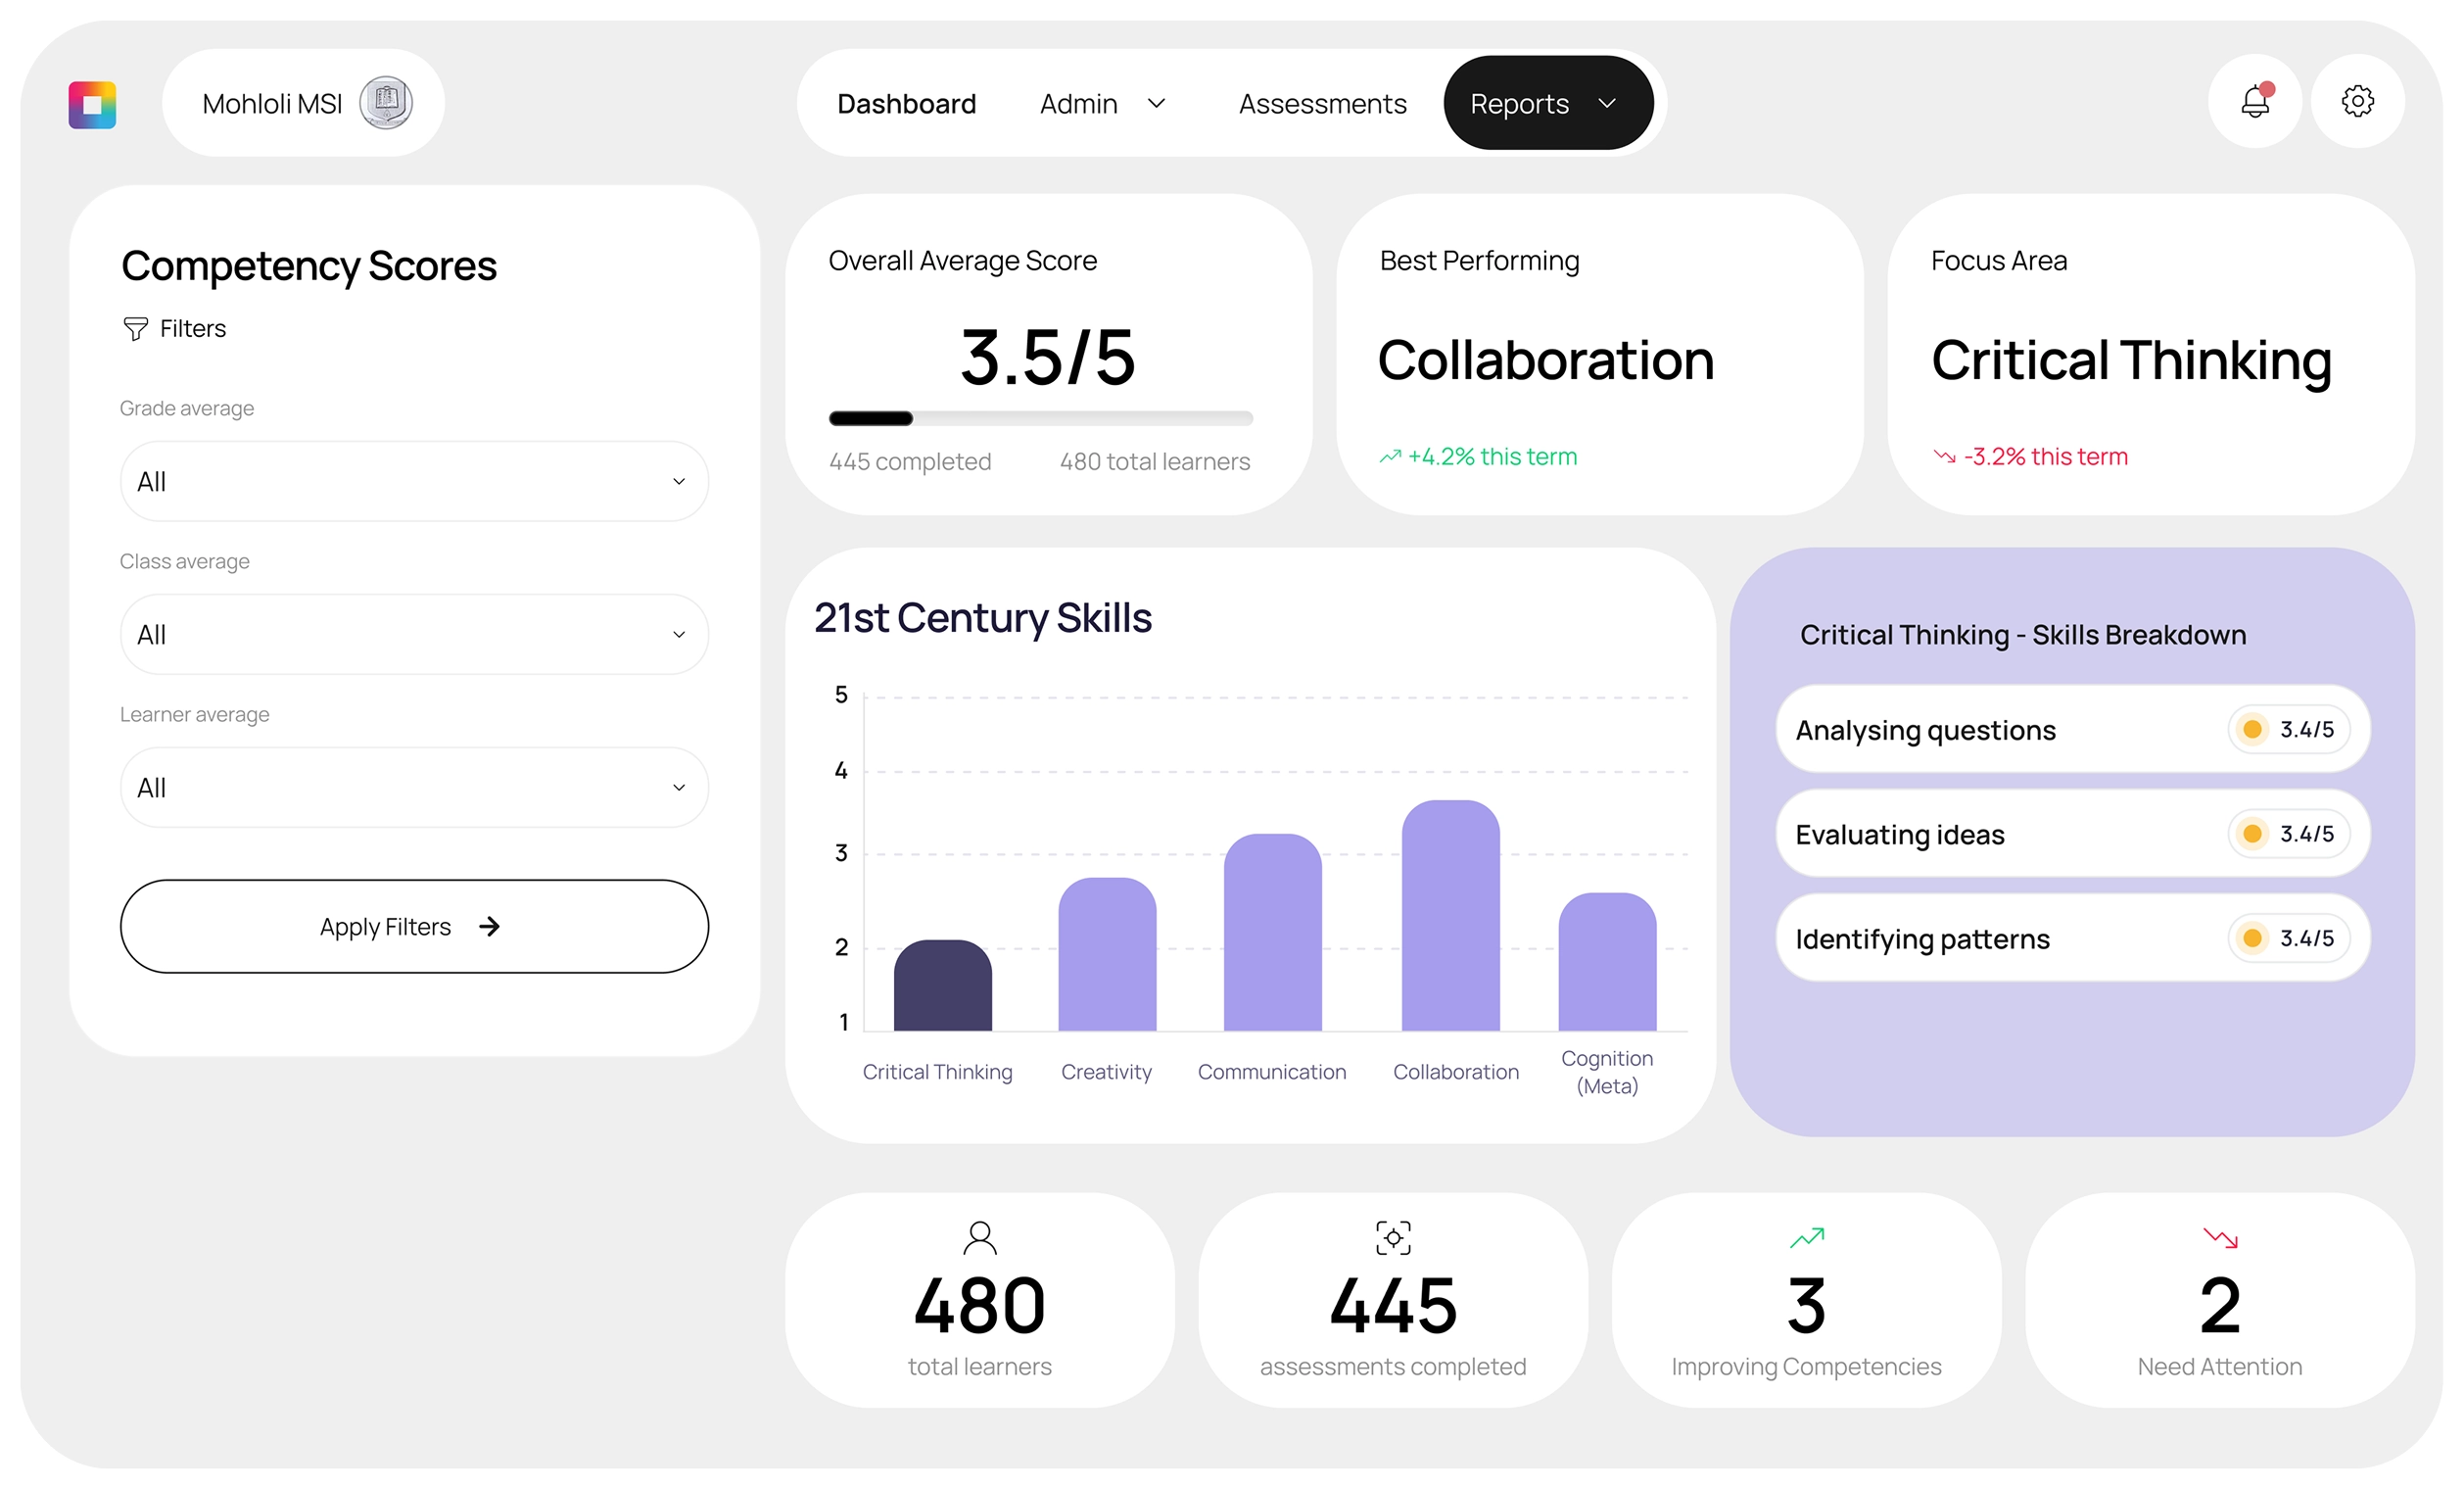
The platform generates reports that show which competencies are demonstrated, with clear explanations and insights into where growth is needed.
04
Skills profiles build over time
Over time, this evidence accumulates into a portable Skills Profile that learners own — a verified record that travels with them into further education and work.
Over time, the Assessment Engine creates a cumulative skills profile — a verified record of what learners can actually do. This evidence becomes a learning-to-opportunity pathway, helping young people access further education, work, or entrepreneurship using demonstrated strengths rather than marks alone.
Who it’s for
Learners
See your own growth. Build a Skills Profile that captures what you can do — not just what you scored. Own evidence that opens doors to opportunity.
Teachers
Understand how your tasks develop competencies. Get structured feedback on learner strengths and gaps. Reduce assessment burden.
Institutions
Track cohorts and programmes over time. Identify where capability development is happening and where it's not. Report on what matters.
Funders
Move from activity metrics to evidence-based impact. See actual shifts in competence across your investments. Trust the data.
See it in action
Request a demo and explore how the AI Assessment Engine can work for your context.

ThinkShift Education Solutions · South Africa · © 2025
made with 💜 by jack